What a prediction-market wallet’s P&L actually tells you
Read profit, entry price, open exposure and win rate together. Two worked examples show why the definitions matter.
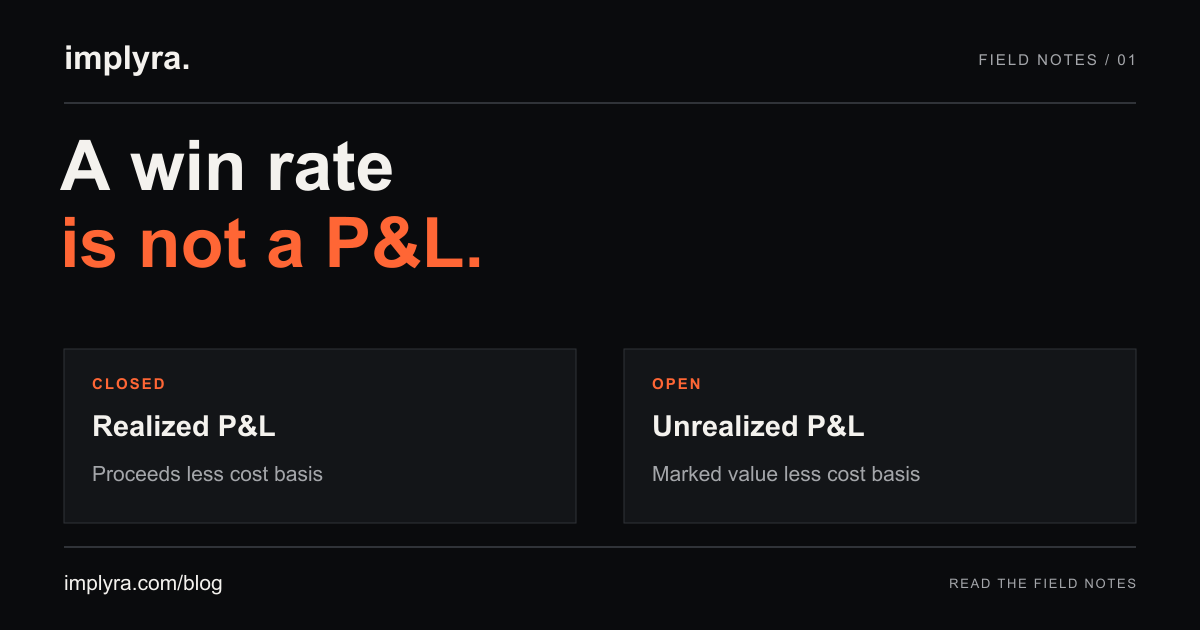
A wallet wins eight of its last ten resolved markets. That sounds convincing until you discover that each position cost 90 cents per share. The winning contracts might not have earned enough to cover the losing ones.
A useful wallet review connects the result to the money committed, the price paid and the positions still open. Every numerical example below is hypothetical. These are accounting and research examples, not records of actual traders or predictions of future performance.
First, define the number
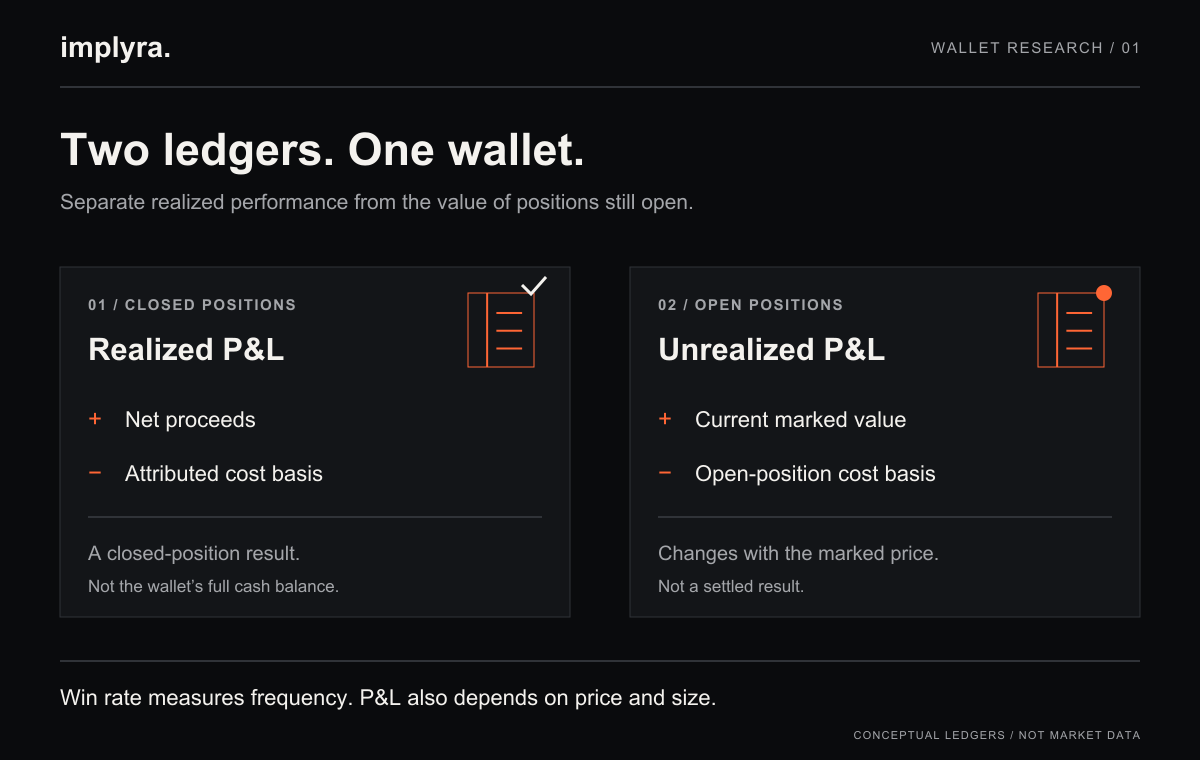
“Profit” can refer to several different measurements. Realized P&L records the difference between proceeds and the allocated purchase cost of positions already sold or settled. Unrealized P&L values the remaining position at a chosen reference price. Portfolio value measures what the holdings are worth under that valuation method; it is not itself profit.
Polymarket’s current-position response includes position size, average price, current value and several P&L fields. Its closed-position endpoint reports realized P&L separately. Those fields are useful inputs, but a dashboard still needs to state its observation time, cost-basis convention, fee treatment and coverage. Similar labels across two services do not establish identical calculations.
Separate completed profit from open exposure
Imagine buying 1,000 Yes shares at $0.40, spending $400. You later sell 300 shares at $0.55 and receive $165. Because every share had the same entry price, the sold shares carried $120 of purchase cost. Their realized profit is $45.
The remaining 700 shares cost $280. If the research snapshot values them at $0.50 each, their marked value is $350 and their unrealized gain is $70. Together, the position has $115 of gross economic profit at that mark. Subtracting $4 of recorded fees leaves $111; this excludes any future exit costs.
| Measurement | Calculation | Result |
|---|---|---|
| Realized P&L | $165 proceeds − $120 cost | +$45 |
| Open position value | 700 shares × $0.50 | $350 |
| Unrealized P&L | $350 value − $280 cost | +$70 |
| Combined, after recorded fees | $45 + $70 − $4 | +$111 |
An 80% hit rate can still lose money
Consider two hypothetical traders. Each buys 100 shares in each of ten separate binary markets and holds every position to an ordinary $1-or-$0 resolution. Ignore fees. Trader A always buys at $0.90 and wins eight markets. Trader B always buys at $0.30 and wins four.
A spends $900 and receives $800 at settlement: a $100 loss. B spends $300 and receives $400: a $100 gain. Both trade the same number of shares, but they commit different amounts of money. Return on purchase cost makes that denominator explicit.
| Trader | Hit rate | Purchase cost | Payout | P&L | Return on cost |
|---|---|---|---|---|---|
| A · $0.90 entry | 8/10 · 80% | $900 | $800 | −$100 | −11.1% |
| B · $0.30 entry | 4/10 · 40% | $300 | $400 | +$100 | +33.3% |
A trade list is only part of the ledger
Polymarket documents splitting collateral into complementary outcome tokens, merging complete sets back into collateral and redeeming after resolution. Its activity endpoint distinguishes these operations from trades. A reconstruction that handles only buys and sells can miss inventory changes or settlement proceeds.
Keep cash contributions separate from trading results. Depositing $500 increases available cash without earning $500. Incoming tokens also need a known or explicitly unknown cost basis; silently treating missing acquisition cost as zero can manufacture apparent profit. Reconcile opening holdings, subsequent activity and closing holdings before trusting a lifetime total.
Use a consistent denominator and sample
Dollar profit rewards scale. A wallet earning $1,000 on $100,000 of purchases and one earning $200 on $1,000 have different research profiles. Purchase turnover, initial capital and maximum capital at risk answer different questions. None should be presented simply as “ROI” without naming the denominator and period.
Sample selection matters too. Reviewing only closed winners leaves open losses outside the picture. Several contracts tied to one event may share the same underlying exposure, so twenty positions need not represent twenty independent decisions. Preserve category and time breakdowns rather than compressing an entire history into one rank.
A practical wallet review
A leaderboard can identify a wallet worth investigating. The useful next step is opening its positions and understanding how the displayed result was assembled. Keep unobserved activity and uncertain valuations visible instead of turning them into confident numbers.
- Read realized and unrealized P&L beside open position value.
- Check entry prices, position sizes and the definition of a winning observation.
- Confirm the history window, fees, settlement activity and treatment of missing cost basis.
- Inspect concentration across related events and the share of results explained by the largest positions.
Sources & further reading
Explore real wallet positions and closed records. Review the displayed coverage limits before interpreting P&L or comparing wallets.
Explore the wallet workspace